Indeed Scraping
Welcome to Indeed Scraping project
Web Scraping:
For this project, I wanted to analyze aerospace and defense-related firms using company reviews from Indeed, a job aggregator site that updates frequently. I scraped the company reviews for 5 AeroDefense Companies (Boeing, Raytheon Tech., SpaceX, Northrop Grumman, and Lockheed Martin) using the libraries, such as requests, BeautifulSoup, and pandas.
Objectives
- The scope of the analysis was limited to these primary objectives:
- To find interesting ‘stories’ that can be mined from the data set.
- To understand key data points of a company.
- To understand the topics of positive and negative reviews by each company (Benefits, compensation, etc.)
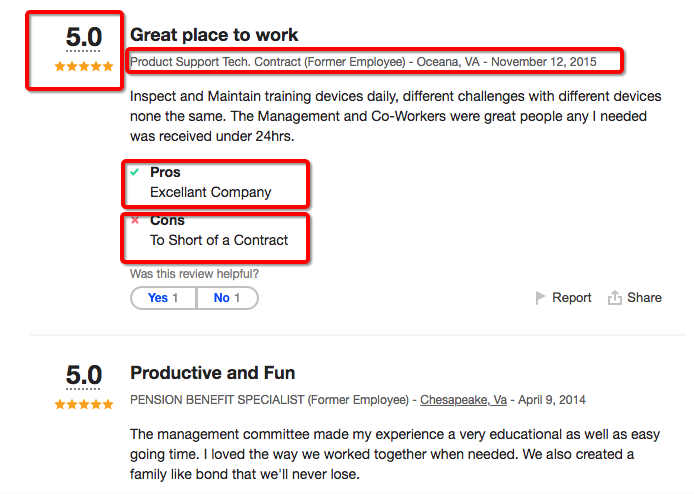
Each review scraped contains the following elements: Company name, Occupation of Employee, Status (Current or Former), Location, Date, Pros, and Cons. For this analysis, I did not scrape the main body of the review due to it not being part of my objectives.
At a Glance:
I gathered around approximately 26,000 reviews from the five firms, notably Lockheed Martin having the highest reviews at 7,800. An excerpt of the Python code is shown below:
for x in results:
	# strips the employee position from the html page
        position = x.find('span', attrs={"class":"cmp-ReviewAuthor"})
        if position:
            #print('Position:', position.text.strip() )
            companyPosition = position.text.strip()
	# strips the rating from the review from the html page
        rating = x.find('div', attrs={'class': "cmp-ReviewRating-text"})
        if rating:
            #print('Rating:', rating.text.strip() )
            companyRating = rating.text.strip()
Cleaning:
Some reviews were unusable as a result of the scraping: either from duplicated reviews or mismatch data row to its column (e.g. a Job Title inside the Date column). I cleaned the data using the combination of Python and R. Python curated the duplicates, and R allowed to strip the Dates into its columns using regex. An excerpt of the code below to create independent columns of day, month, year, and weekday using R.
rawdata <- fread('Indeed/filtered.csv', fill = TRUE)
# extract year, month, date, and weekday from fulldate
rawdata$year <- format(as.Date(rawdata$Date, format="%B %d, %Y"),"%Y")
rawdata$month <- format(as.Date(rawdata$Date, format="%B %d, %Y"),"%m")
rawdata$day <- format(as.Date(rawdata$Date, format="%B %d, %Y"),"%d")
rawdata$weekdays = format(as.Date(rawdata$Date,format="%B %d, %Y"), "%A")

# remove reviews with NA year/month/day (only 5 observations removed)
rawdata <- rawdata[!is.na(rawdata$year),]
rawdata <- rawdata[!is.na(rawdata$month),]
rawdata <- rawdata[!is.na(rawdata$day),]
Results:
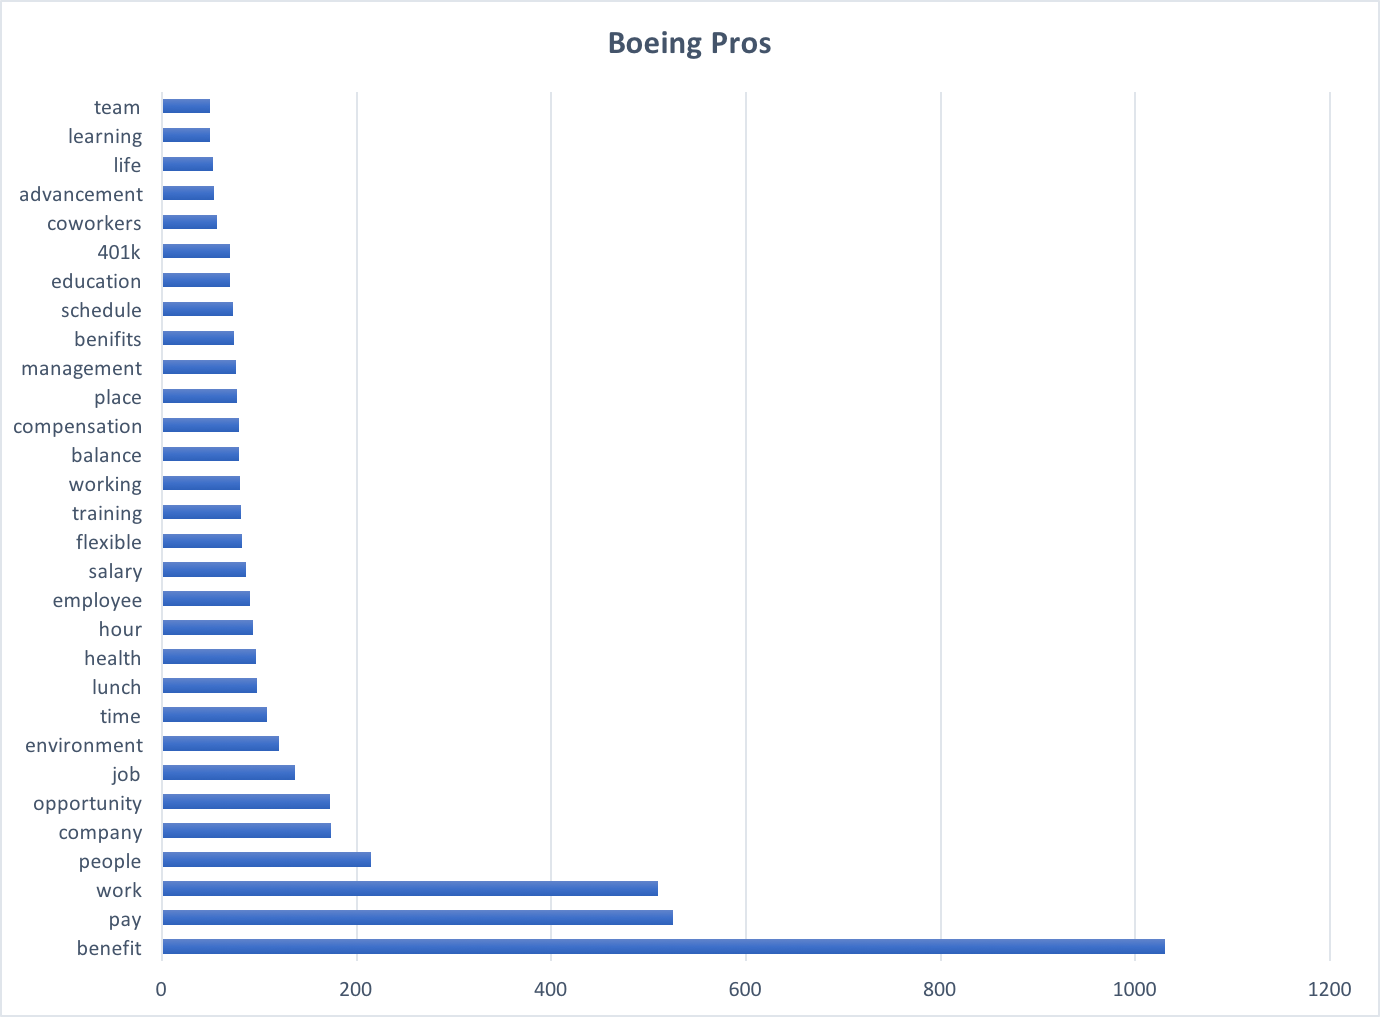
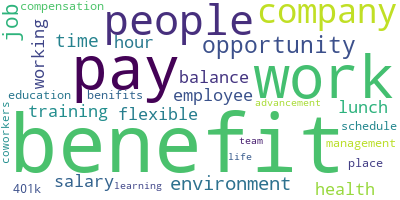
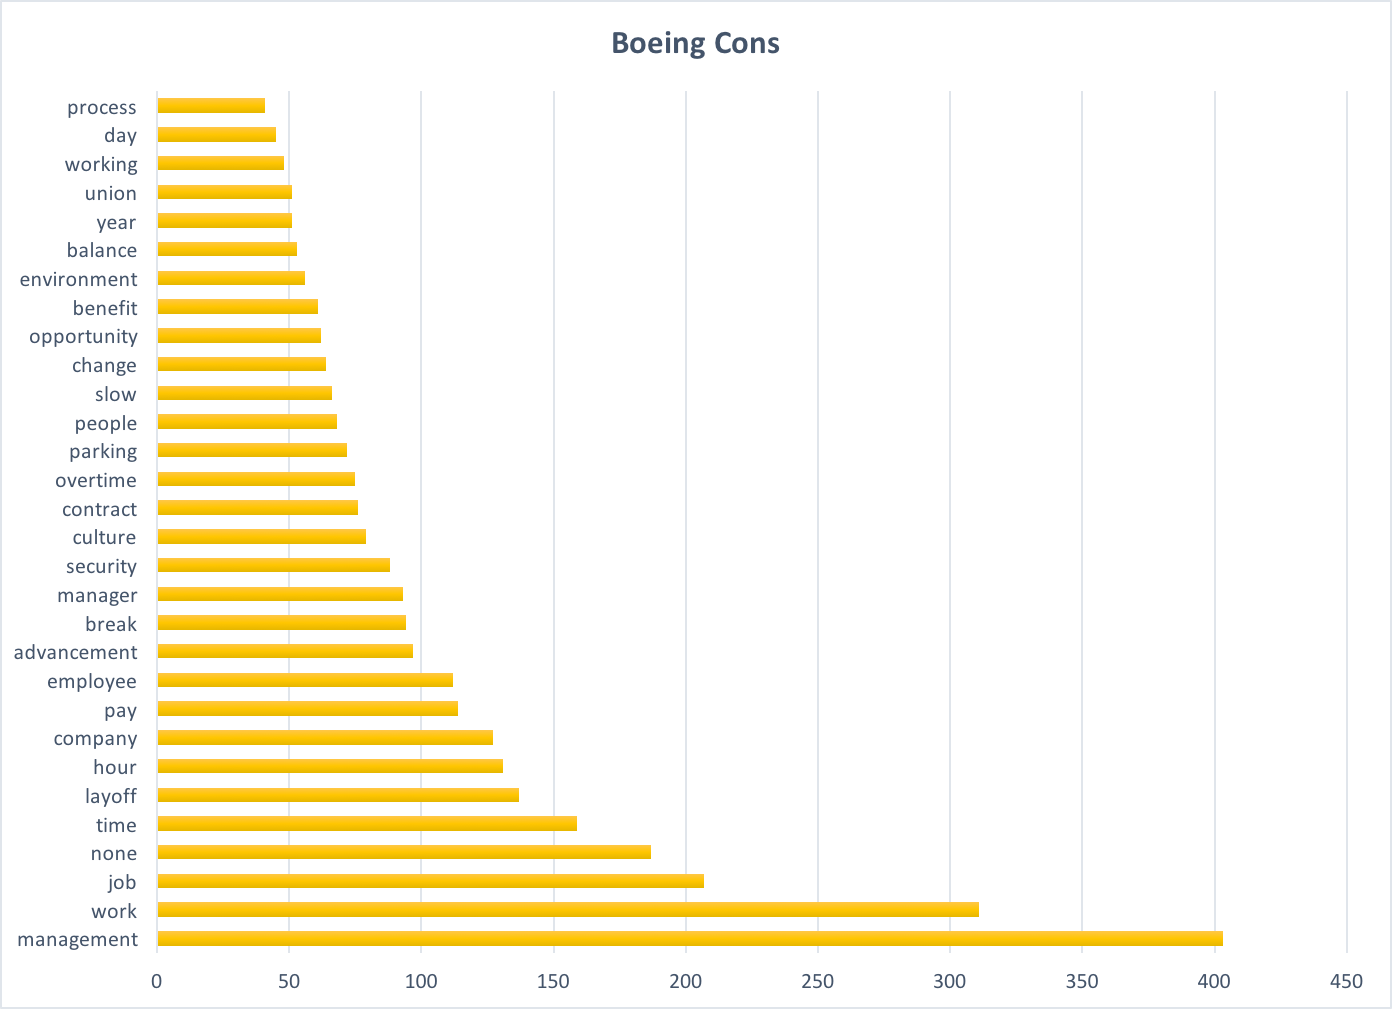
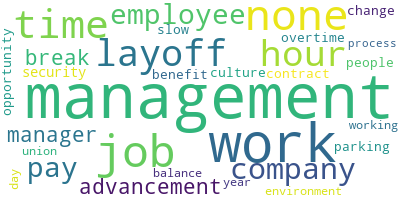
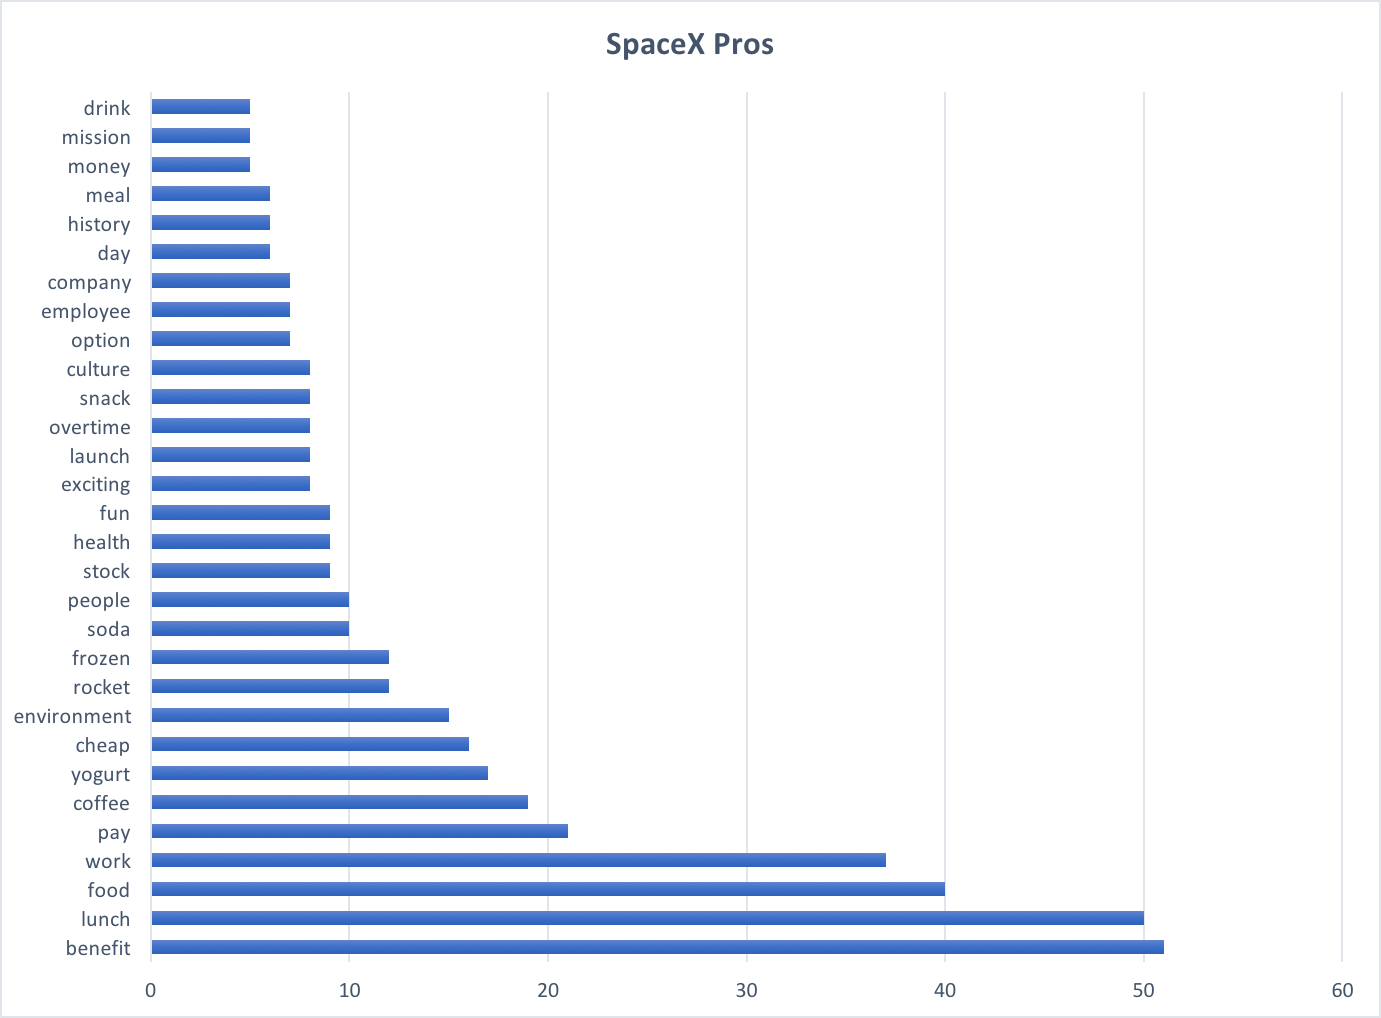
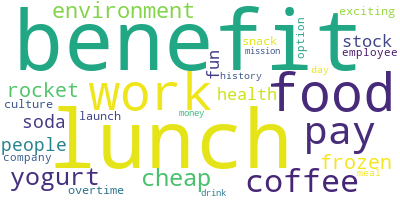
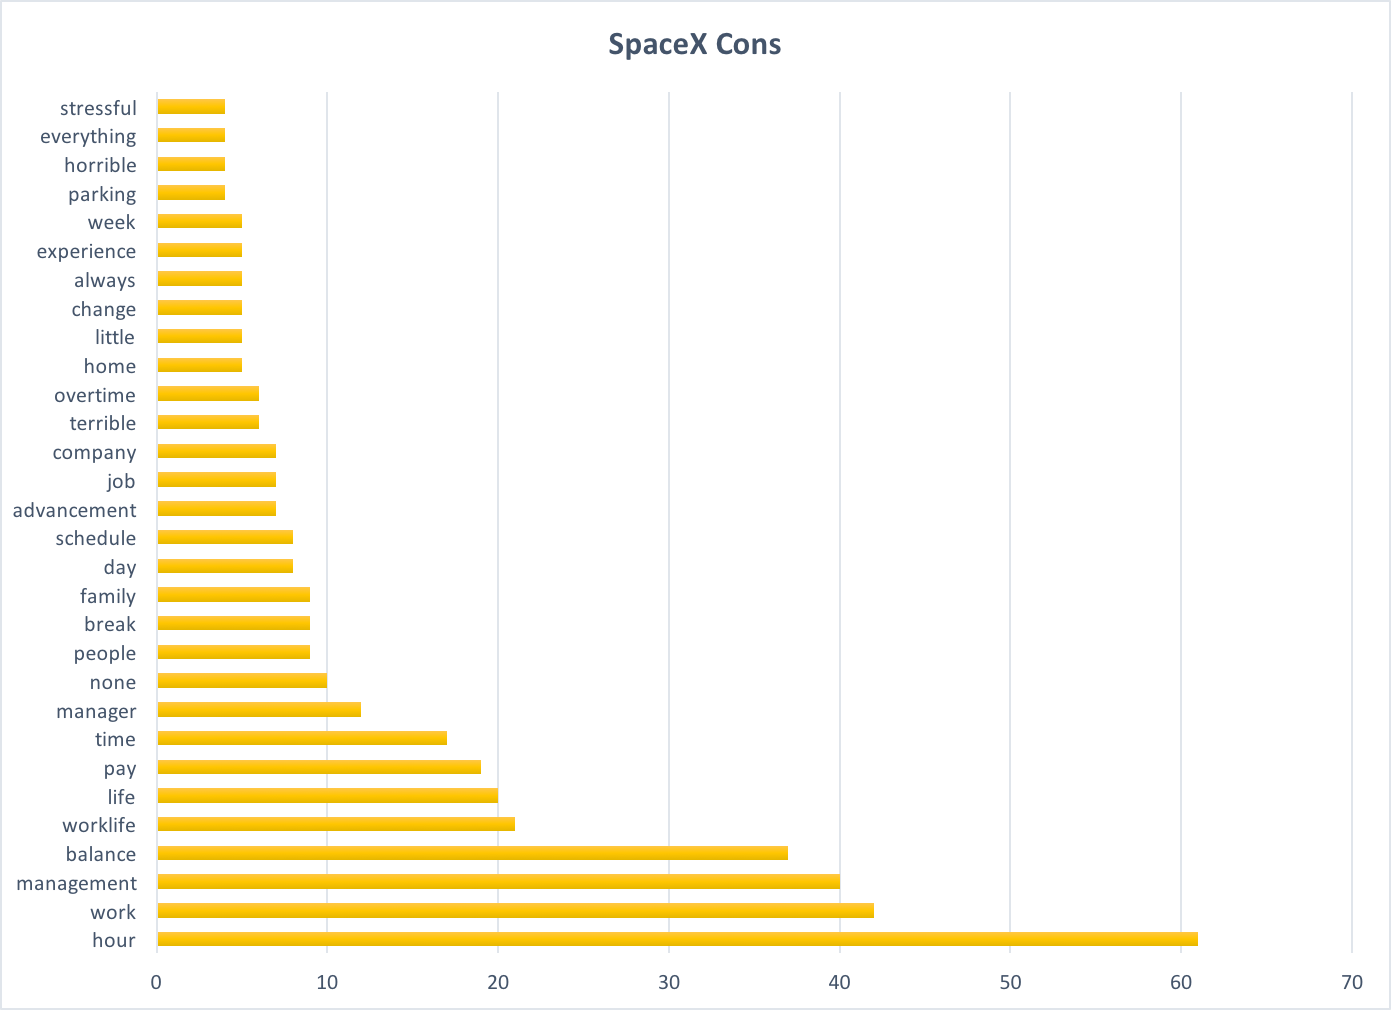
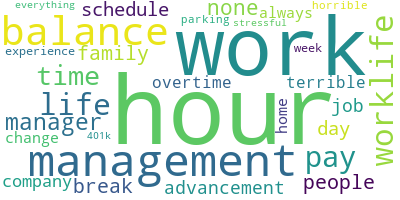
One of the most simple yet efficient methods of presenting data is using Wordclouds. Python and R have libraries that allow for simple wordcloud presentation. For this project, I used Python as a testing ground for creating the wordcloud files of each company.
Boeing Pros
Boeing Cons
SpaceX Pros
SpaceX Cons
Using R for more analysis:
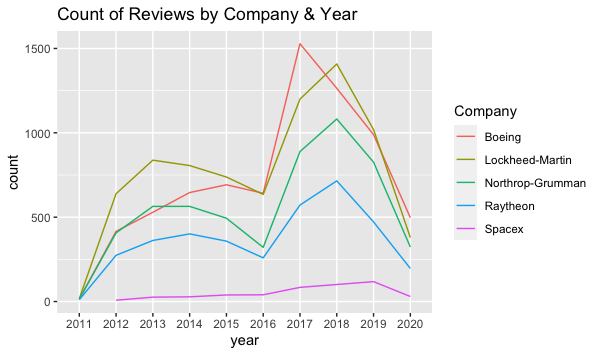
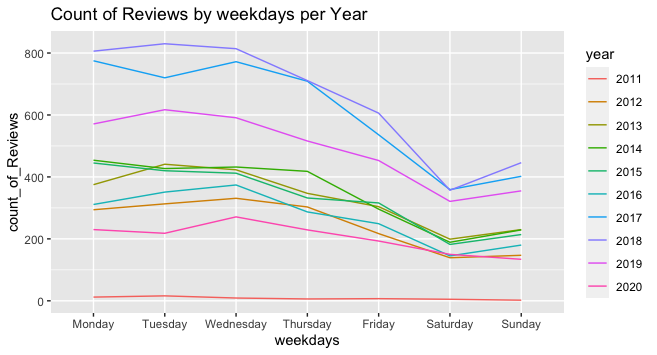
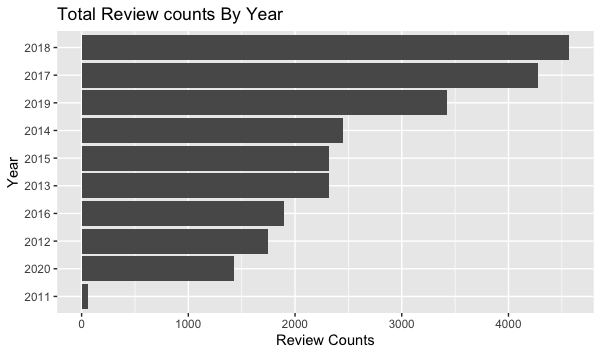
As seen below, the number of reviews has peaked in 2018, with the numbers decreasing again in 2019-2020. Additionally, the reviews are more likely to be posted at the beginning of the week, with Saturday being the least day of posting.
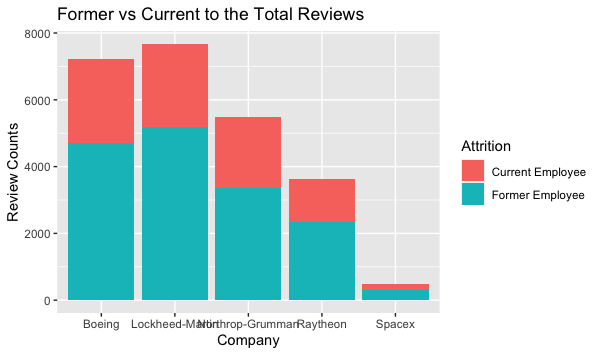
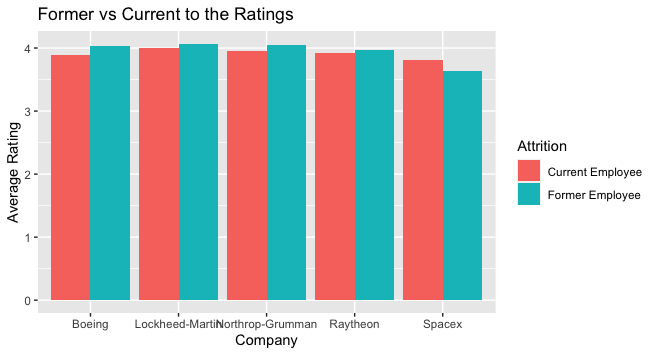
A majority of the reviews came from former employees. Likewise, contrary to my expectations, Former Employees tend to view their past employers more favorably. The exception of this find is SpaceX, which might be due to the low number of reviews.
